Machine_Learning_From_Scratch
Machine Learning From Scratch
![]()
![]()

![]()

![]()


![]()
With good visualisations
Without using any ML libraries
Now available in [spkit](https://pypi.org/project/spkit/) library
Installation
Install spkit pip install spkit
from spkit.ml import LR, NaiveBayes, ClassificationTree, RegressionTree
(Few visualisations are limited to 2D data only, others can be used for any dimenntions)
View Github page
Table of contents
- Logistic Regression
- Naive Bayes
- Decision Tree
- Neural Network (matlab/octave)
- Deep Neural Network-DeepLearning
- Convolutional Network
- Recurrance Neural Network
- Kernel Learning & Regularization
- Support Vector Machine (yet to implement)
- Extra Tree; Classification & Regression
- Random Forest
- Linear discriminant analysis (LDA)
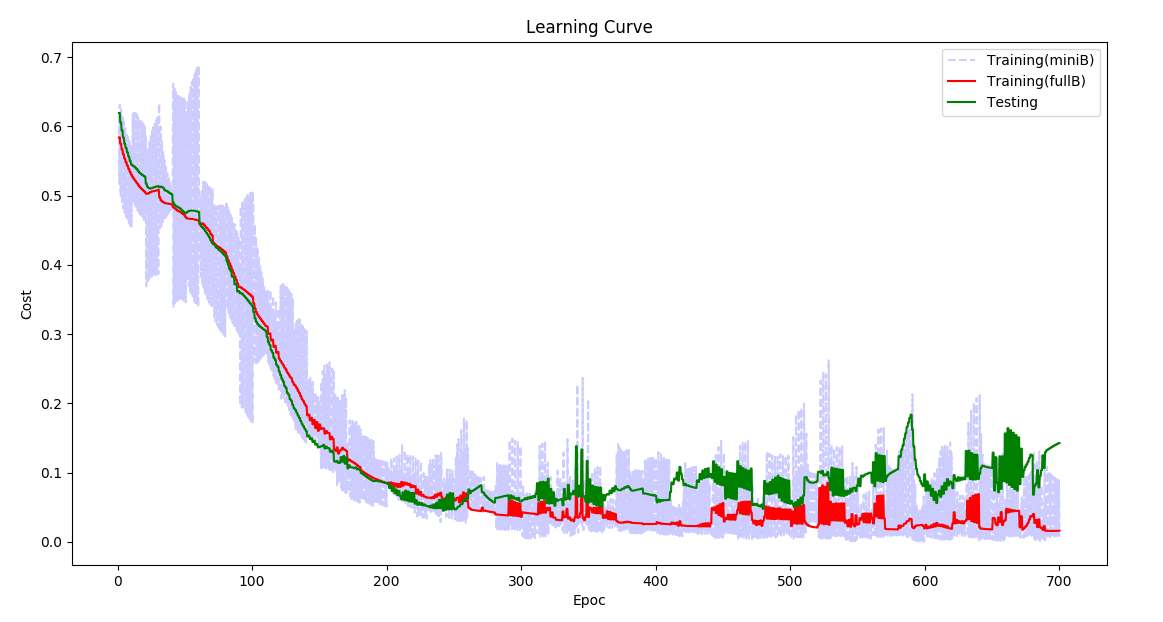
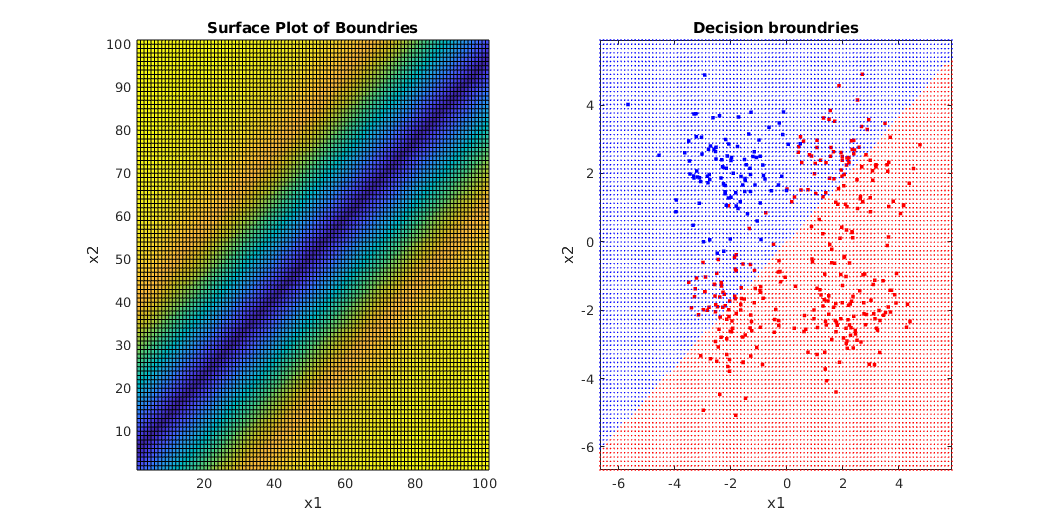
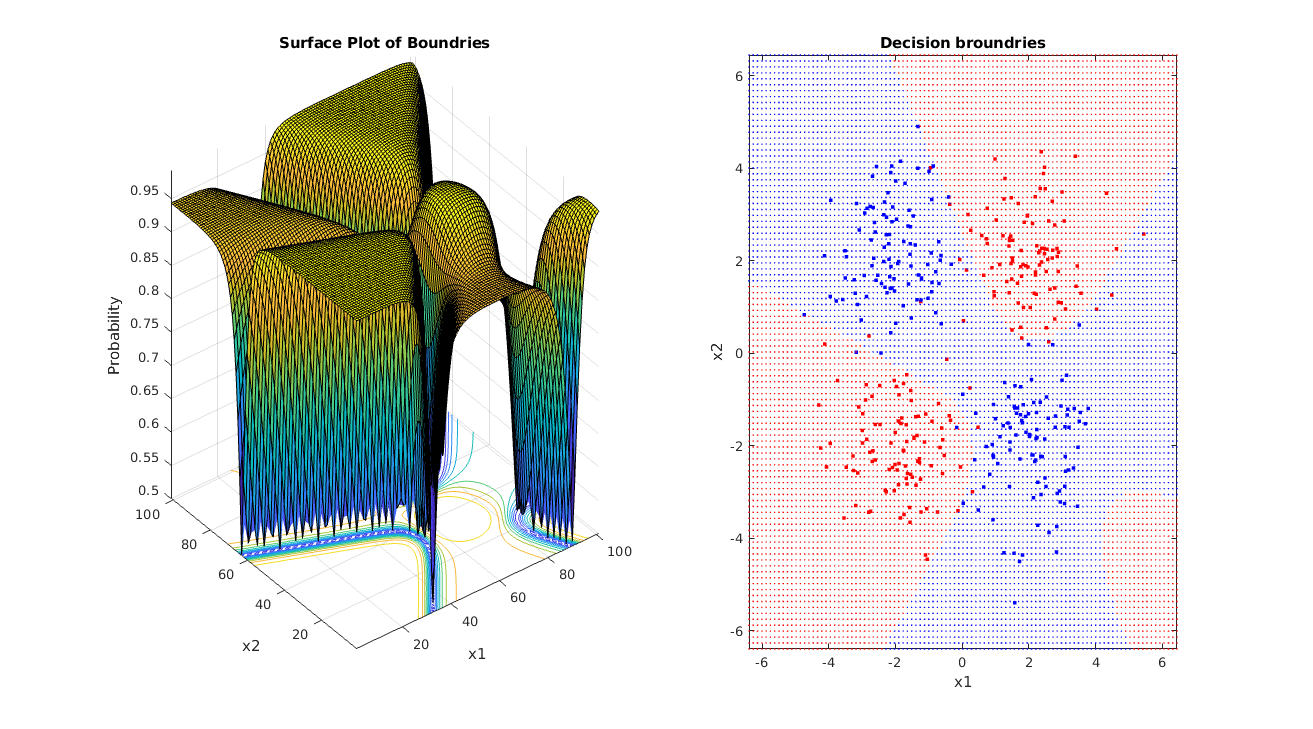
1. Logistic Regression
Code ans examples are here
Download (right click and ‘save link as’):

#from LogisticRegression import LR # given code

##NOW USE spkit library (pip intall spkit)
from spkit.ml import LR
clf = LR(X,y,alpha=0.003,polyfit=True,degree=5,lambd=2)
fig=plt.figure(figsize=(8,4))
gs=GridSpec(1,2)
ax1=fig.add_subplot(gs[0,0])
ax2=fig.add_subplot(gs[0,1])

for i in range(100):
    Clf.fit(X,y,itr=10)
    ax1.clear()
    Clf.Bplot(ax1,hardbound=False)
    ax2.clear()
    Clf.LCurvePlot(ax2)
    fig.canvas.draw()
    plt.pause(0.001)

clf.predict(X)
W,b =clf.getWeight()
2. Deep Neural Network - Deeplearning
Code and examples are here
Full detail of implementation and use of code is describe here


### Download (right click and ‘save link as’):
- Download the reposatory
- Jupyter-Notebook
- Class file:: DeepNet.py
- example1.py
- example2.py
- example3.py
3. Neural Network (simple structure-fully connected) with any number of layers (Matlab/Octave)
Code and examples here
Network can be created and trained as for example
W= NeuralNet(X,y,HL,Iterations,alpha,verbose);

% For 2 hidden layers with 5 and 3 neurons, 500 iteration and 0.1 alpha(learning rate)
% input and output layers are chosen according to data X,y provided

W= NeuralNet(X,y,[5,3],500,0.1,1);

% for 8 hidden layers
W= NeuralNet(X,y,[15,10,10,10,5,5,5,3],100,0.1,1);

returns weights W of each layer
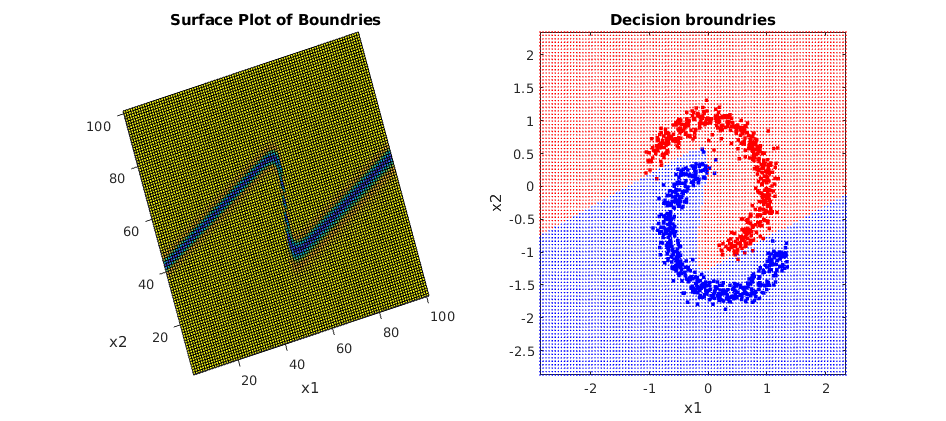
4. Kernel Learning & regularization
Methods
- Regularized Least Squares -RLS Referance
- Nu-Method Referance
- Iterative Landweber Method Referance
- Singular Value Decomposition Reference
- Trunctated SVD Referance 1 Referance 2
- Spectral cut-off
Kernal Learning
(Linear, Polynomial, Gaussian)
- Linear
- Polynomial
- Gaussian (RBF)
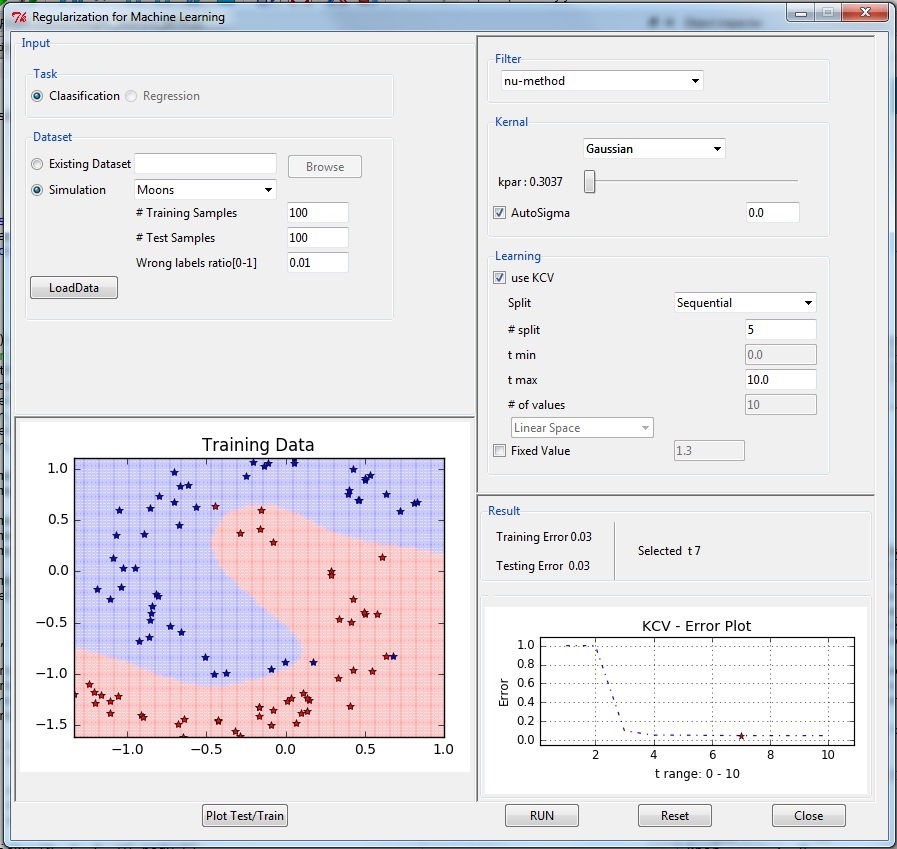
Code and examples with GUI are given here
Installation::
pip install regml
Execute
import regml
regml.GUI()
Download (right click and ‘save link as’):
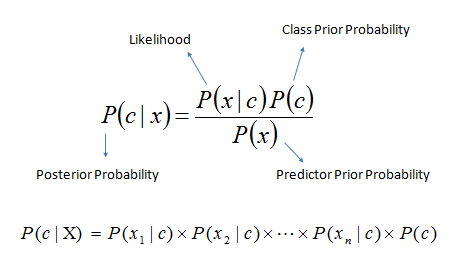
5 Naive Bayes
Probabilistic model
Classifier based on Bayes rule:
Example with jupyter notebook here and Repository
Notebook include example of Iris data, Breast Cancer and Digit classification (MNIST)
Notebook
Class file
Download (right click and ‘save link as’):
here is code snippet
import numpy as np
import matplotlib.pyplot as plt

# For dataset
from sklearn import datasets
from sklearn.model_selection import train_test_split

# Library provided
#from probabilistic import NaiveBayes (NO NEED OF THIS)

##NOW USE spkit library (pip intall spkit)
from spkit.ml import NaiveBayes

data = datasets.load_iris()
X = data.data
y = data.target

Xt,Xs,yt,ys = train_test_split(X,y,test_size=0.3)

print(Xt.shape,yt.shape,Xs.shape,ys.shape)

# Fitting model (estimating the parameters)
clf = NaiveBayes()
clf.fit(Xt,yt)

# Prediction
ytp = clf.predict(Xt)
ysp = clf.predict(Xs)

print('Training Accuracy : ',np.mean(ytp==yt))
print('Testing  Accuracy : ',np.mean(ysp==ys))

print(clf.parameters)

# Visualization
fig = plt.figure(figsize=(12,10))
clf.VizPx()

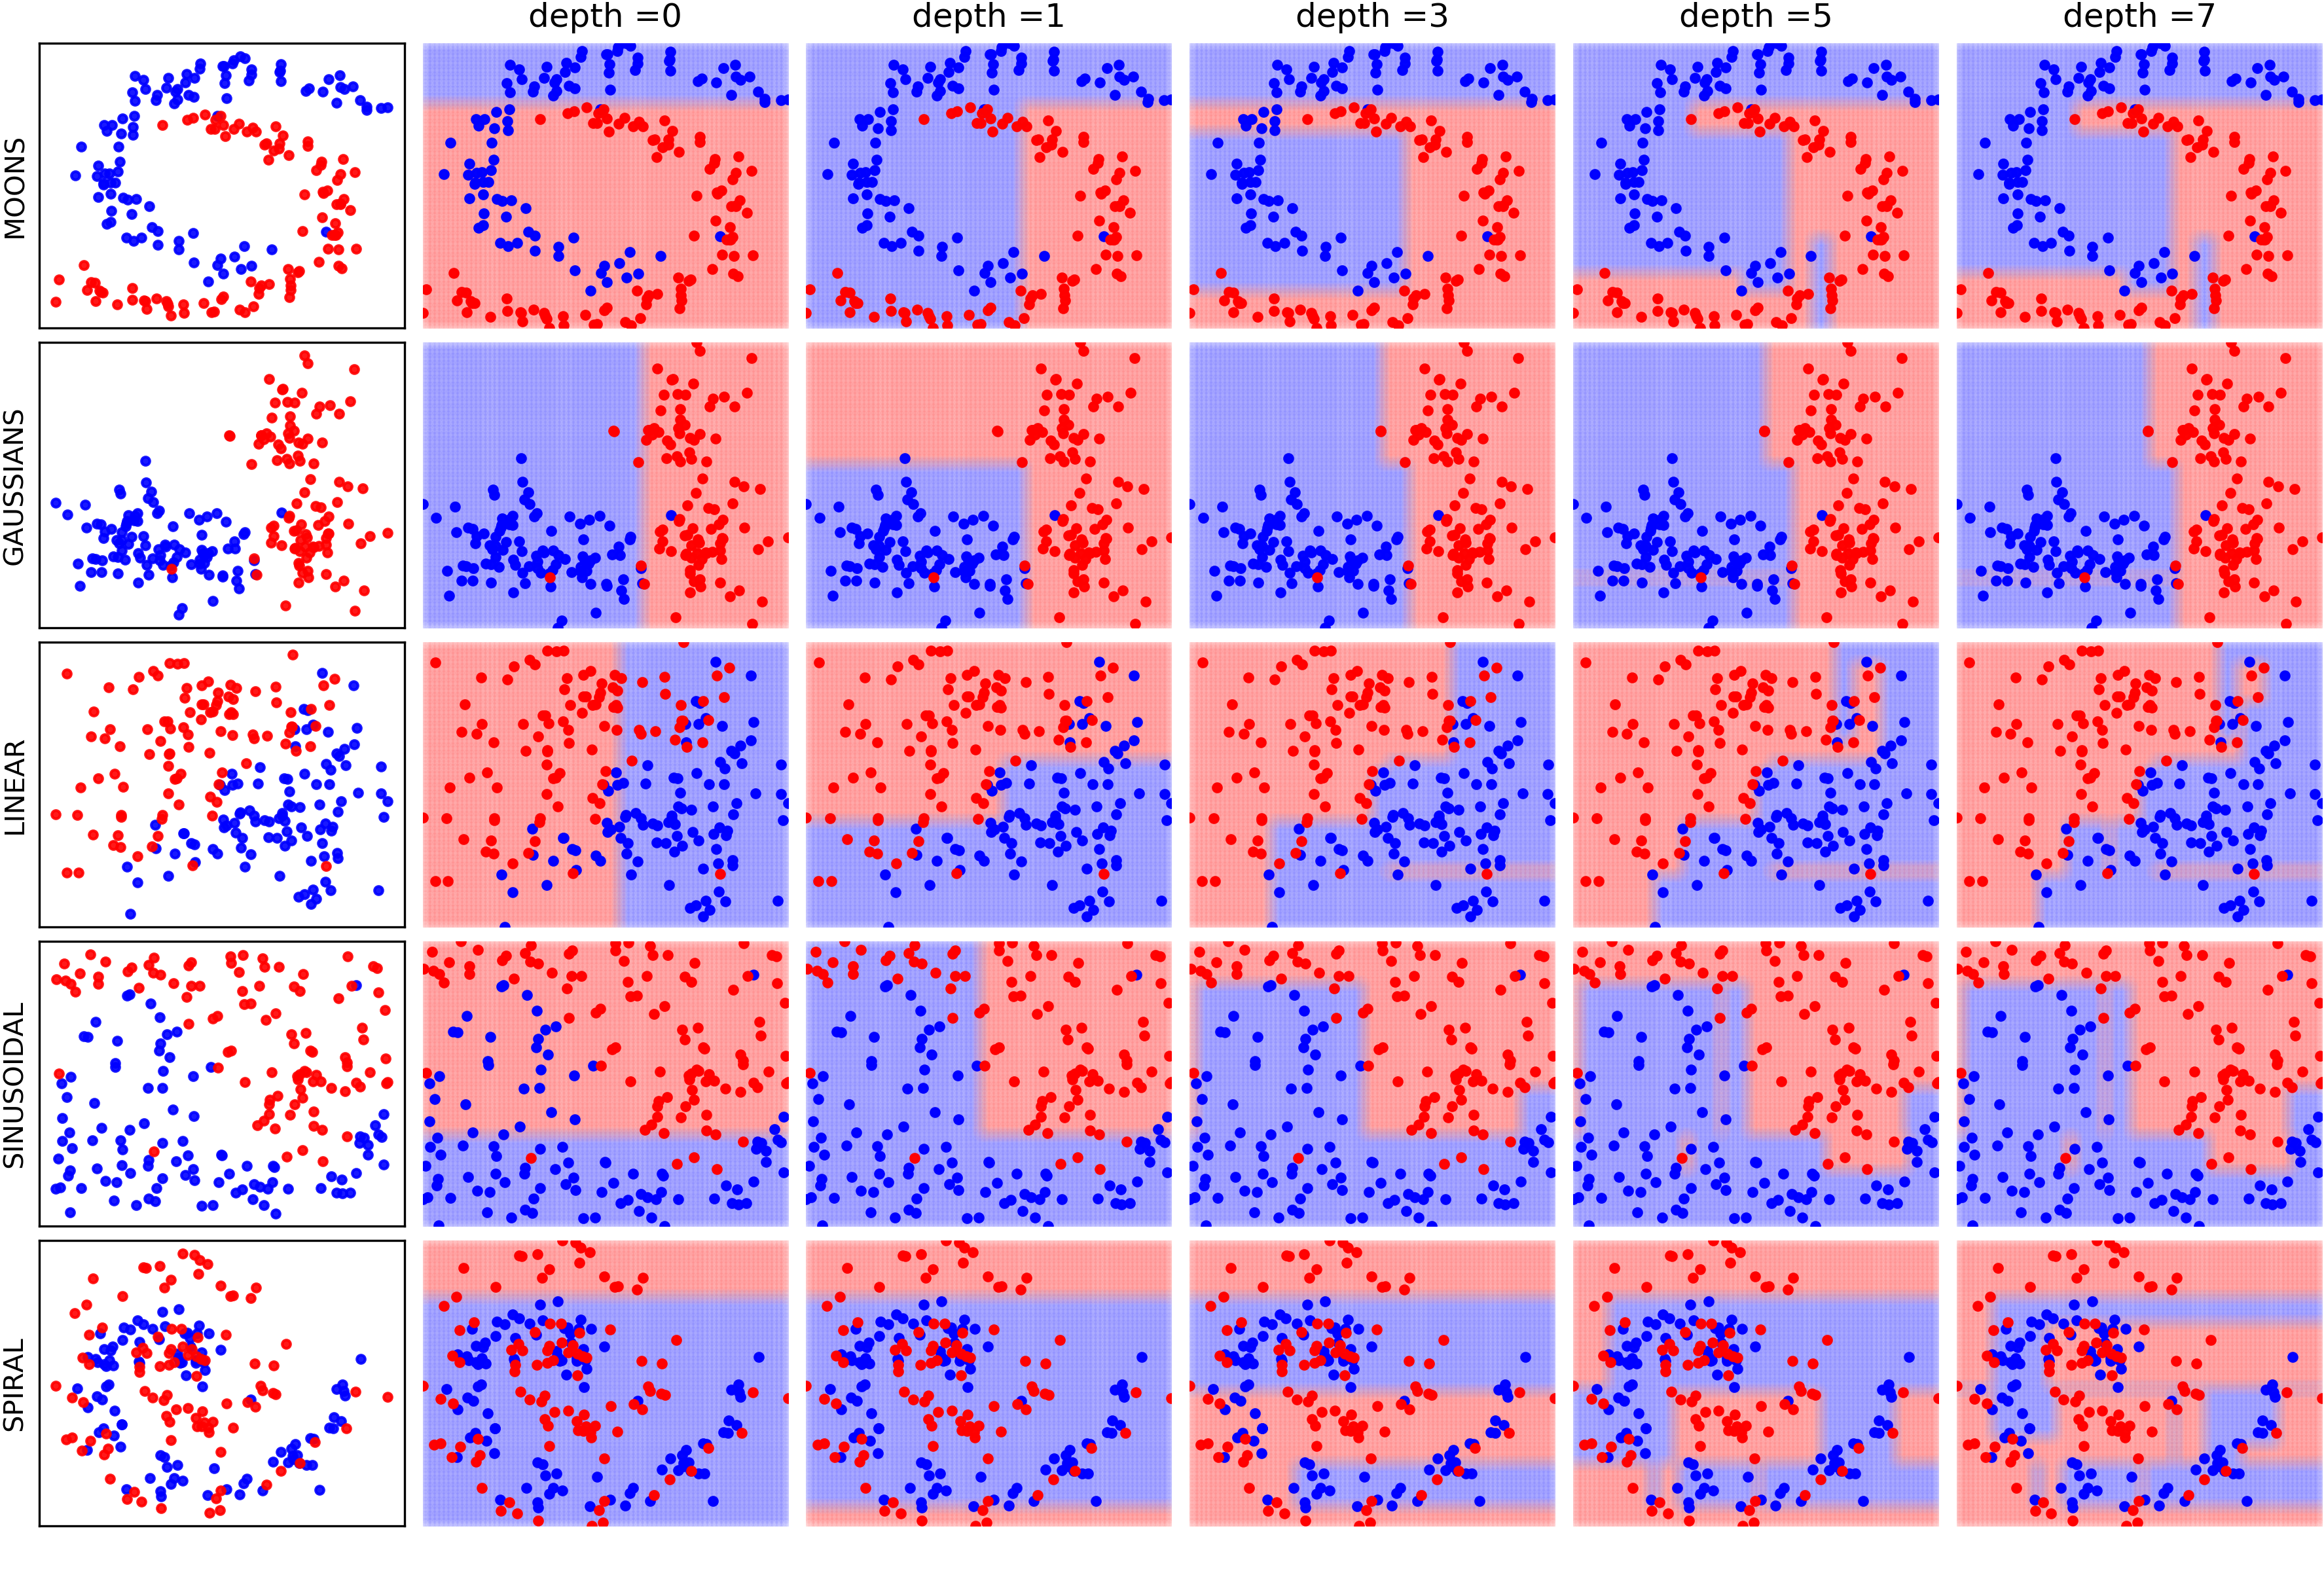
6 Decision Trees
Installation (Now in spkit library)
pip install spkit
Classification and Regression Tree
Requirement: All you need for this is Numpy and matplotlib** (Of course Python >=3.0)
See the examples in Jupyter-Notebook or Repository for more details
Notebook
Download (right click and ‘save link as’):
Import
import numpy as np
import matplotlib.pyplot as plt

#(NO NEED OF THIS)
#Download trees.py and keep in current directory or give a path (if you know how to)
#from trees import ClassificationTree, RegressionTree

##NOW USE spkit library (pip intall spkit)
from spkit.ml import ClassificationTree, RegressionTree

# For examples
from sklearn import datasets
from sklearn.model_selection import train_test_split
Iris Data
data = datasets.load_iris()
X = data.data
y = data.target

feature_names = data.feature_names #Optional
Xt,Xs, yt, ys = train_test_split(X,y,test_size=0.3)
Initiate the classifier and train it
clf = ClassificationTree()

# verbose 0 for no progress, 1 for short and 2 for detailed.
# feature_names is you know, else leave it or set it to None

clf.fit(Xt,yt,verbose=2,feature_names=feature_names)
Plot the decision tree
# Plot Tree that has been learned
plt.figure(figsize=(15,8))
clf.plotTree(show=True)
Visualizing the tree building while training
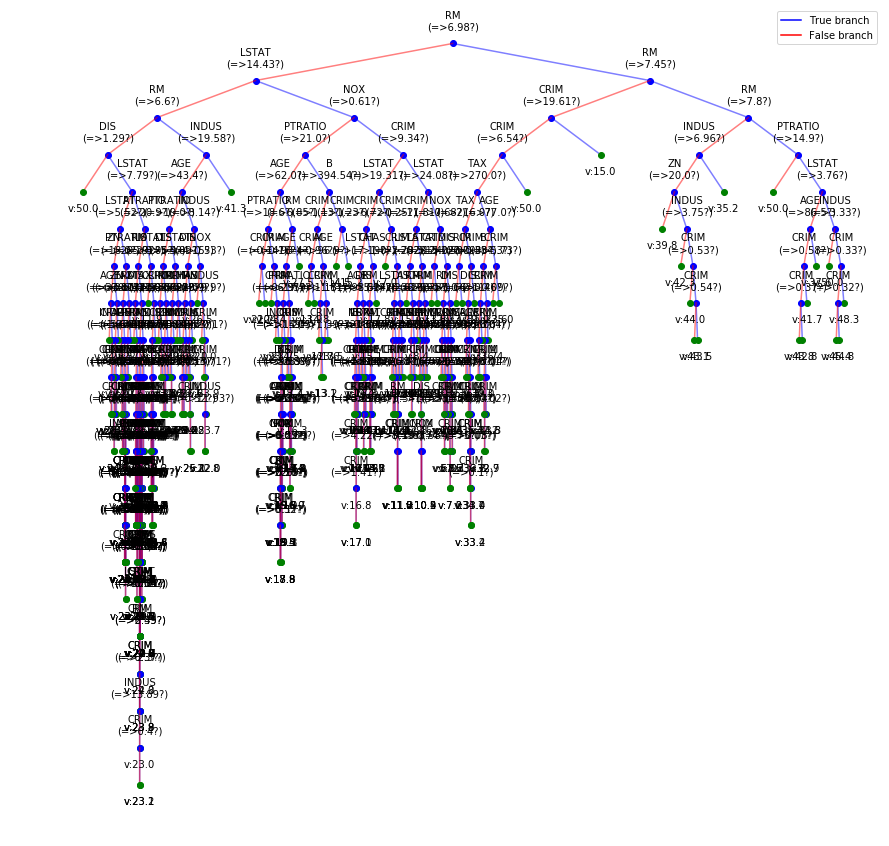
Classification: Iris Data, Breast cancer Data Regression::Bostan House price Data
Visualization of decision tree after fitting a model
Option to show colored branch: Blue for True and Red for False Or just show all branches as blue with direction to indicate True and False branch
Iris data: Decesion Tree | Cancer data: Decesion Tree
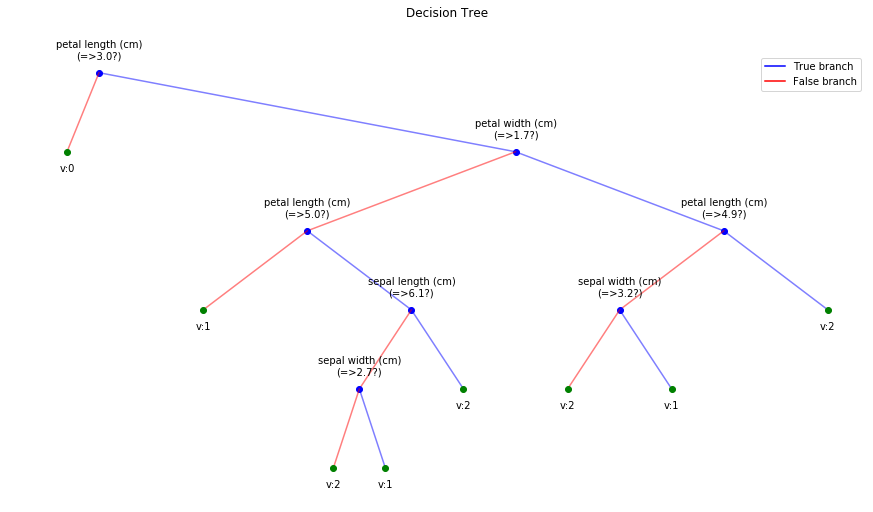 |
|
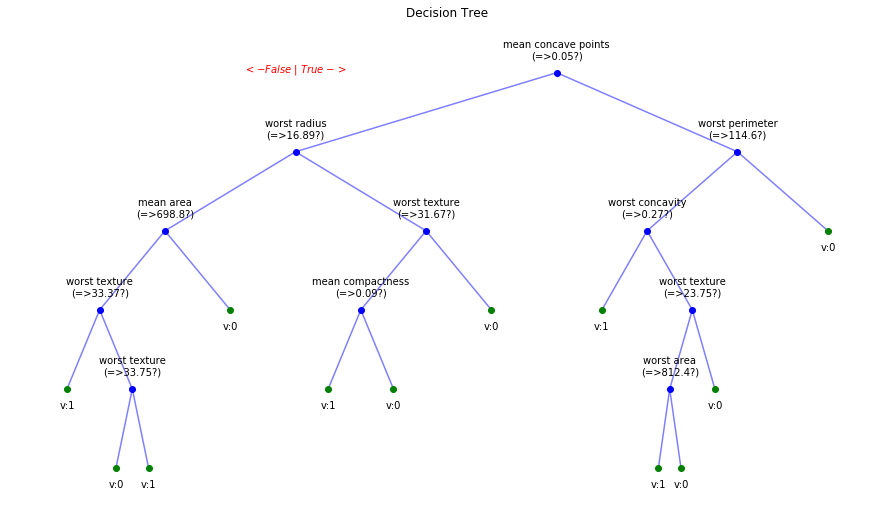
Boston data: Decesion Tree
Visualizing the progress of tree building while training
Tree building for Cancer Data (Classification)
Detailed view
Short view